The economics behind mistrust in India’s GDP data, in 5 charts

At the start of the week, the Union government released the economic growth rate for the April to June quarter, pegging growth at around 7.8%. This is, historically speaking, a very robust rate of economic growth. And yet, possibly for the first time, a section of the public is unwilling to accept the figure.
The most curious aspect of this mistrust in the latest official data is the trust placed in last year’s official data, which belongs to a now-discarded data series. What is even more odd is that this questioning seems to have been triggered by a patently flawed understanding of data by a former Finance Secretary, as explained here.
Old vs new series
For several years now, India’s GDP (gross domestic product, the measure of total economic output) data has been questioned by several academics, as well as international institutions such as the International Monetary Fund. Such critics, some of whom have earlier held senior positions in the government, have provided well-founded counters to official calculations and argued that India was overstating its economic output.
In February this year, the government undertook a revision of the GDP series, along with that of other key data series such as retail inflation, apart from introducing new surveys to capture the economy more accurately.
However, the first quarterly GDP data release under the new and reformed data series seems to run into mistrust. To be sure, while critics may still be demanding more transparency and improvements, none of the experts is arguing that the new series is worse than the previous one, which, even by the government’s own admission, was overstating the GDP.
The question is: Why has official data, which shows a very handsome rate of growth, received such a negative response from the common man? Why has the trust faded in such a manner that people are now using the same data, which until February was blamed for overstating GDP, as the benchmark?
Story continues below this ad
The most common answer is: The GDP growth rate does not tally with the lived experience of the people. Prima facie, there is enough evidence to indicate this.
What data show
Here are five factors that point to the economic underpinning of this mistrust in government data.
1. Employment has stagnated. (see CHART 1)
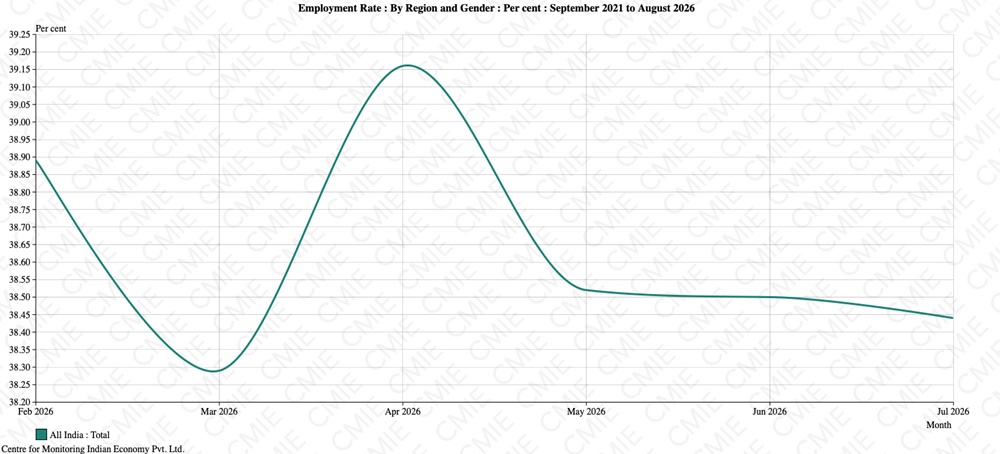 Chart 1.
2. The labour force has declined (see CHART 2), showing fewer people actively demanding jobs, most likely because discouraged workers stop actively looking for work.
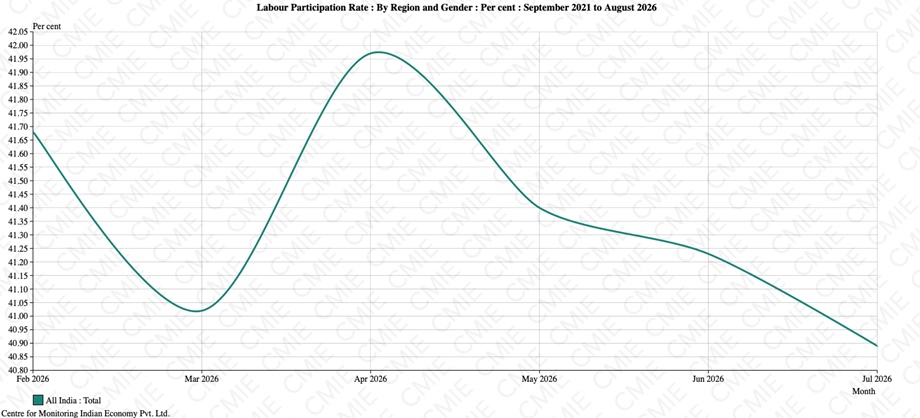 Chart 2.
3. Wages have been heading south (see CHART 3). This is data from the Centre for Monitoring Indian Economy (CMIE). A CMIE report notes: “The average wage rate declined by 1.5 per cent in July. This was the fifth monthly decline in the 12-month period ending July. Also, the wage rate has declined twice in the last three months and as a result, the recent three months have been particularly stressful on the wage rate front.”
Story continues below this ad
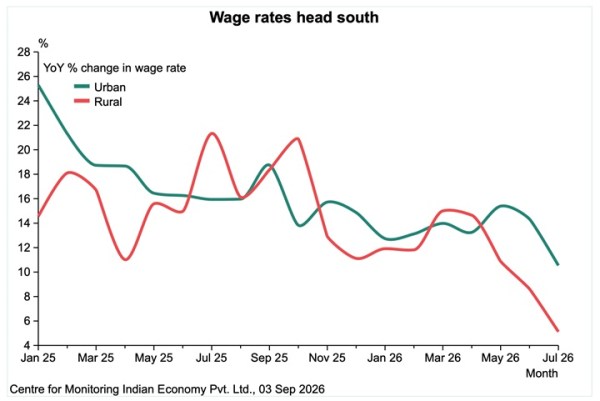 Chart 3.
4. Retail inflation has been rising (see CHART 4), and the spike in food inflation has been even sharper, rising from just around 2% in January to over 5% in July.
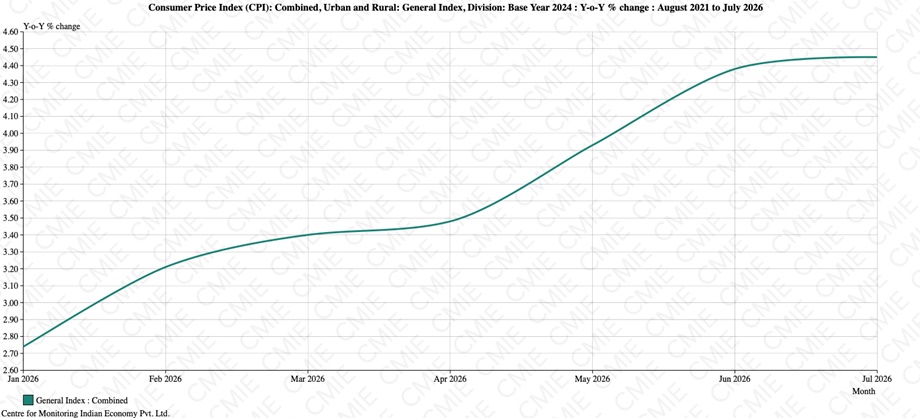 Chart 4.
5. Unsurprisingly, all manners of consumer sentiment are in negative territory (see CHART 5).
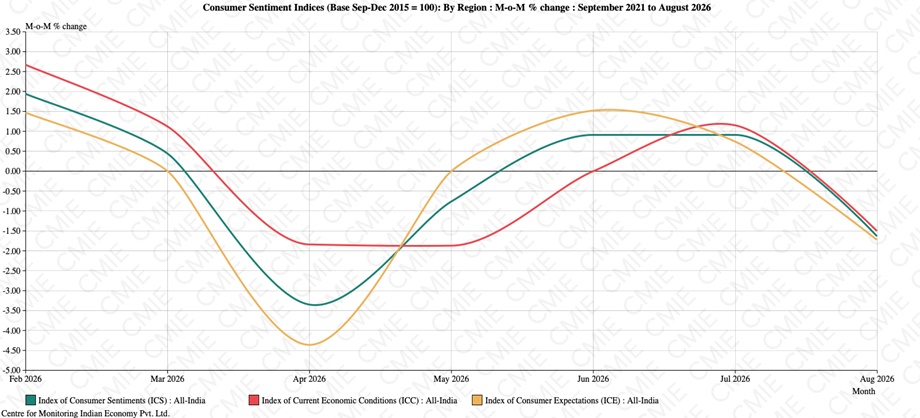 Chart 5.
In a research note, Mahesh Vyas, the CEO of CMIE, writes: “July 2026 was not the best of times for Indian households. Employment had stagnated and labour force had shrunk. Consumer sentiments were weak and inflation was above 4 per cent for a second consecutive month. This was also the month when the delayed monsoon had seriously hampered the kharif sowing schedule and youth protests in the capital had intensified dramatically.”
10 differences are hiding in this living room—find them in 60 seconds
By Sohail Khan · 4 Sep
A tennis table in the kitchen and Salman Khan’s artwork: Inside Sania Mirza’s Dubai home
By Sohail Khan · 4 Sep
Why this 3-step meal sequence is a secret game changer for your blood sugar
By Sohail Khan · 4 Sep
Leave a Reply