Weather Bee: El Nino’s impact on global rainfall in four maps
Weather Bee: El Nino's impact on global rainfall in four maps
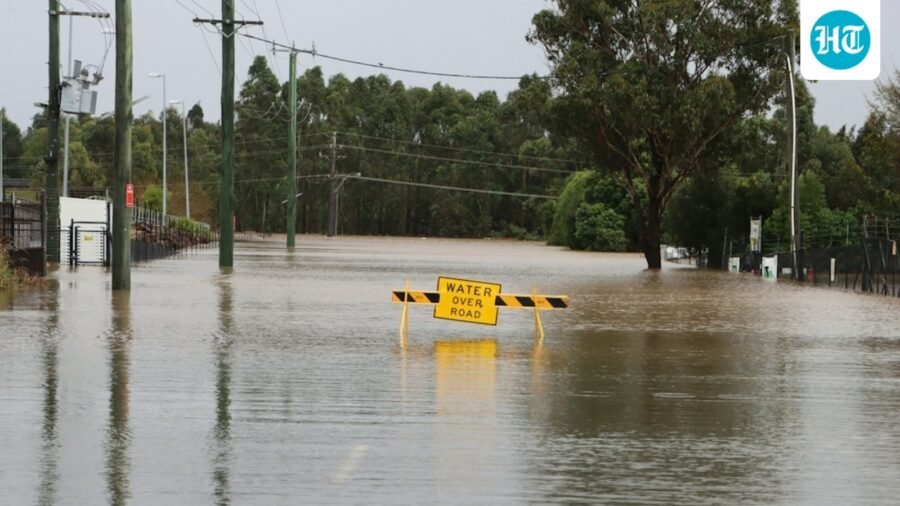
El Nino has suppressed India’s monsoon rainfall in 2026, while its impact on rainfall patterns across Australia, Asia and the Americas varies.
Updated on: Oct 3, 2026, 11:43:13 IST
Prefer HTon Google
Share via
Copy link
The 2026 El Nino that started in May has now been in place for five full months. This is also the period when its impact on global weather is not expected to be very strong because it is yet to reach its peak. However, even during this period, it does have some impact, such as suppressing June-September monsoon rainfall in India. How was its impact on rainfall elsewhere? The following four maps explain this.
A brief explanation of El Nino is useful in assessing its impact on rainfall. It is described as a cyclical warming of the central-eastern equatorial Pacific Ocean. This can be seen in the streak of warmer-than-normal sea surface temperatures (SSTs) along the equator, running from the Americas to the central region of the Pacific Ocean.
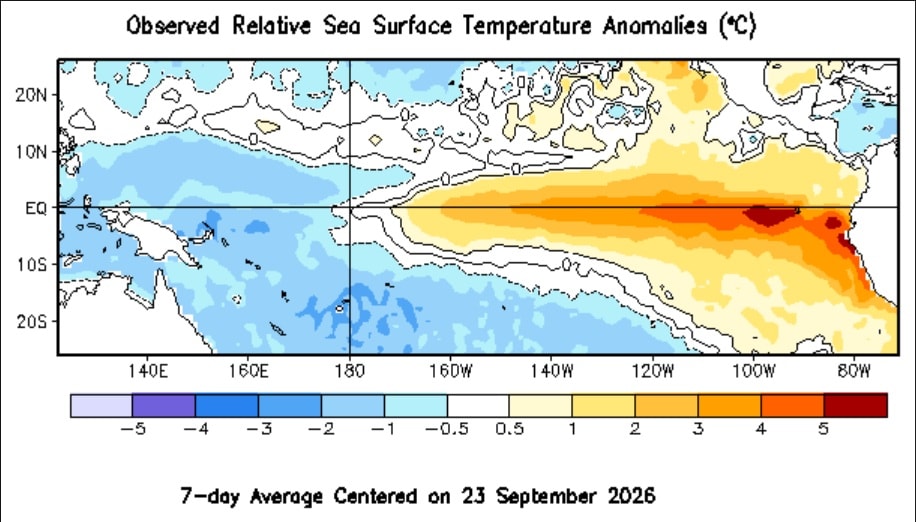
The warm SSTs in the central-eastern Pacific Ocean lead to lower-than-normal air pressure above the region. This aids the formation of clouds. A crude explanation for this is that warm SSTs aid the formation of water vapour, which rises up to fill in the space in the atmosphere being created by lower air pressure. In contrast, the cooler-than-normal SSTs in the western Pacific lead to higher-than-normal air pressure there, which suppresses cloud formation.
As expected from the contrast between the eastern and western halves of the equatorial Pacific described above, an El Nino increases rainfall in the western parts of the two Americas. On the other hand, countries like Indonesia, Malaysia, and the eastern half of Australia — which are west of the Pacific — see lower rainfall than usual. This can be seen in rainfall's average deviation from normal in the eight El Nino years during the 1979-2025 period for which rainfall data is available. To be sure, it is possible that there were more years affected by an El Nino during this period. The accompanying map only shows the deviation for years when the May-September period averaged El Nino levels of warming in the central-eastern Pacific.
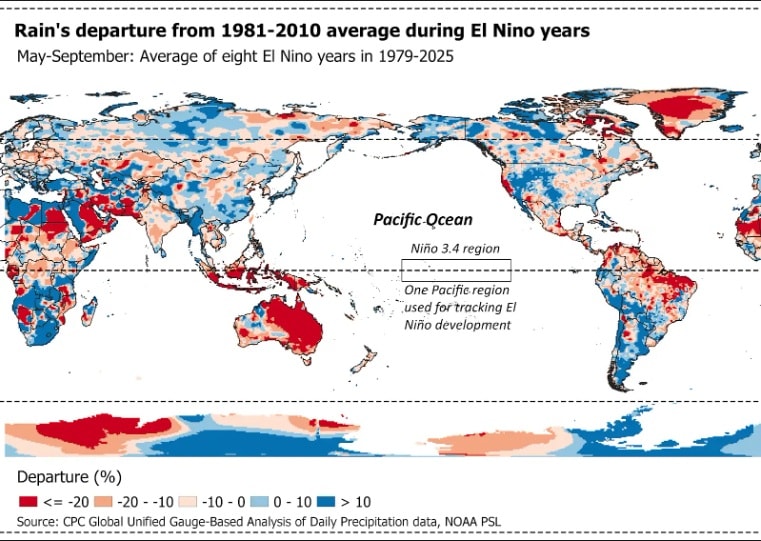
To be sure, as the map suggests, El Nino's impact on rain does not have a neat east-west division. Parts of China, for example, have averaged more than normal rain even during El Nino years. Similarly, parts of India have also averaged more than normal rain in such years, although overall monsoon rain is generally suppressed. This is because El Nino is not the only phenomenon that affects rain.
The broad patterns seen in the past have also held in May-September 2026. The contrast between the regions drier and wetter than usual may appear starker than the average in the past. That is expected because averages paper over variations seen in individual years. One such variation this El Nino is that parts of India have had more than normal rains. This was explained by earlier this week. Similarly, the western half of the USA does not appear as wet as it usually is when an El Nino takes hold during May-September.
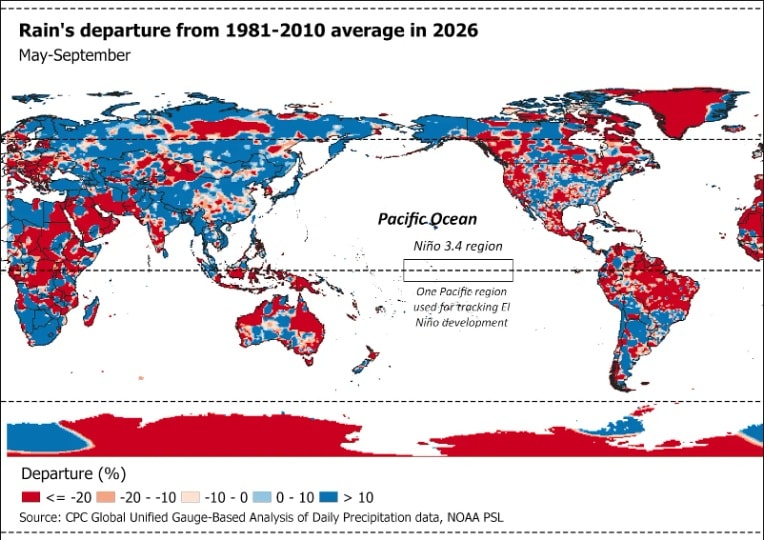
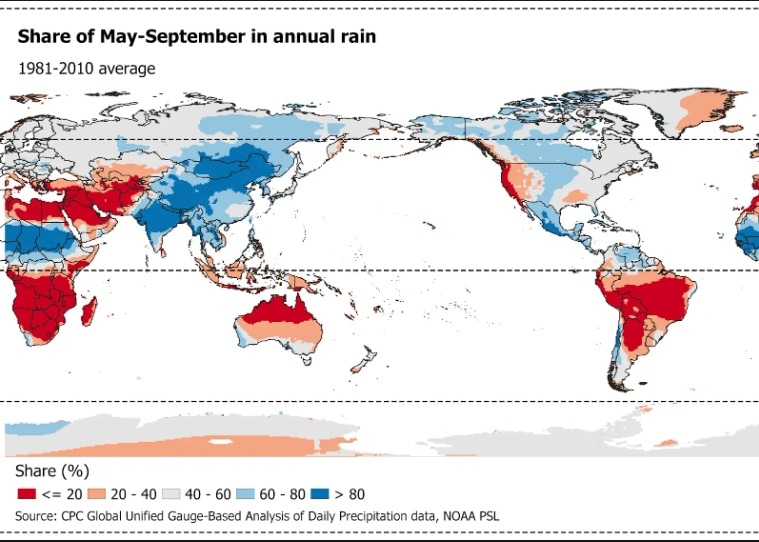
To be sure, these numbers must be read with the fact that May-September rain is not as important everywhere as it is in India. For example, it accounts for 20% or less of annual rain in the northern half of Australia and only up to 40% of annual rain in countries like Indonesia and Malaysia. The same goes for the USA's west coast and most of South America.
See Less


Karachi’s women delivery riders navigate traffic, stigma and the road to independence
By Sohail Khan · 3 Oct

Leave a Reply