India’s latest GDP revisions: How, and why, does GDP data get updated?
Economic data in India is never without its share of debates. And GDP numbers — old, new, revised, or updated — attract the most noise and questions. This week has been no different.
The “is-growth-2.6%” question warrants no further discussion — in previous articles, we have explained why comparing GDP from different base years is fundamentally flawed.
What does require an explanation, however, are the upward and downward revisions to GDP growth rates going as far back as 2023-24.
The short, complicated-sounding answer comprises five words: “using PPI for double deflation”. The longer, simpler answer is below.
Extent of past revisions
Revisions to past GDP numbers, especially quarterly ones, happen all the time.
This is because quarterly numbers are compiled using what is called a “benchmark-indicator approach”.
In this method, movement in quarterly GDP estimates is guided by changes to relevant high-frequency indicators such as crop production, cement production, finished steel consumption and commercial vehicle sales.
Story continues below this ad
Annual GDP estimates, meanwhile, are based on actual output and numbers. As more and more ‘actual’ data becomes available for a particular quarter — say from companies’ financial results and the statistics ministry’s surveys — the quarterly estimates are revised.
While these reasons were behind the large upward revision from 7.8% to 8.6% for the GDP growth in January-March 2026 (Q4 of FY26), changes to older data were primarily because the Ministry of Statistics and Programme Implementation (MoSPI) shifted to a new indicator, the PPI (Producer Price Index), to adjust nominal GDP to real GDP.
Deflating to get ‘real’
On February 27 this year, MoSPI unveiled a new series of GDP data after changing the “base year” from 2011-12 to 2022-23. Every economy undergoes regular base year revisions to incorporate new data sources, improve methodology and capture data more accurately.
While rebasing, the ministry overhauled its methods of calculating the GDP, including how it removes the effect of inflation from “nominal” GDP to arrive at the “real” GDP.
Story continues below this ad
GDP is calculated by summing together the value created — or Gross Value Added (GVA) — by each sector, adding indirect taxes collected by the government, and subtracting subsidies given.
This GVA is the difference between the value of what a sector produces (output) and the raw materials (inputs) it uses. This is the “nominal” GVA, or GVA in current prices.
The trouble begins while calculating “real” GVA.
Until now, the value of inputs and outputs for each sector and the various subcategories were “deflated” by the same number, except for agriculture and mining and quarrying.
This number was either the Consumer Price Index (retail inflation), the Wholesale Price Index (wholesale inflation) or one of their sub-indices, depending on what is to be deflated.
Story continues below this ad
Then the “real” input value was subtracted from the “real” output value to arrive at “real” GVA. This process is called “single deflation”.
Single vs double deflation
The single deflation method works fine when prices of inputs and outputs are changing at the same rate; when they don’t, there’s a problem.
Ideally, the value of inputs should be adjusted by input inflation and outputs by output inflation. This is called double deflation and ensures that the real GVA is accurate.
In the 2022-23 GDP series, MoSPI made the move to double deflation after repeated criticism that single deflation was leading to either underestimation or overestimation of real growth, depending on how input and output prices were moving.
Story continues below this ad
Consider the following: a sector uses Rs 100 of inputs in a particular financial year to make Rs 200 of output. The nominal GVA, therefore, is Rs 100.
Say in the next financial year, the value of inputs and outputs rises by 20% each to Rs 120 and Rs 240. The nominal GVA, then, is Rs 120 and nominal GVA growth 20%. Also, assume that input prices rise by 5% and output by 2%.
The real GVA in the second year, however, will depend on what process is followed: single or double deflation.
Single deflation: Assume a 3% common deflator for both input and output. This leads to real GVA being Rs 116.5. Real GVA growth is 16.5% and the deflator is 3%.
Story continues below this ad
Double deflation: By deflating input and output values by their respective 5% and 2% inflation rates, the real GVA is Rs 121. Real GVA growth is 21% and the deflator is -0.8%.
Double-deflation implication
All this means two things.
One: when input prices are rising faster than output prices, single deflation can underestimate real GVA growth.
Two: the negative implicit deflator helps ensure that when nominal growth is low — as was the case in April-June 2026, at 10.3% — due to less than full pass-through of higher costs to consumers, it does not incorrectly penalise real growth.
Some economists are puzzled by how the manufacturing deflator has been negative in six of the 13 quarters for which new GDP series data is available starting April-June 2023. The answer to this again lies in double deflation.
Story continues below this ad
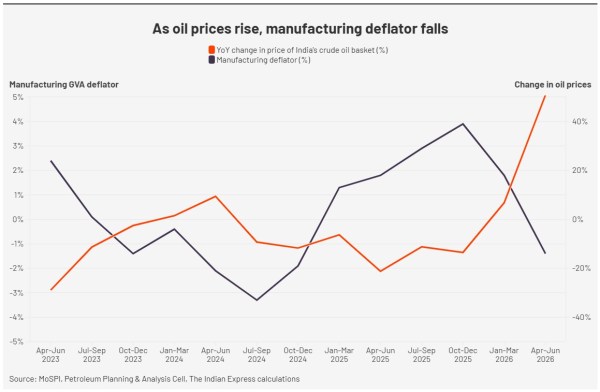 The manufacturing deflator falls when the price of crude oil is rising.
The above chart juxtaposes the manufacturing GVA deflator with the year-on-year percentage change in the price of India’s crude oil basket, a crucial input for Indian manufacturers. The inverse movement is striking: the manufacturing deflator falls when the price of crude oil is rising.
According to economists at ICICI Securities Primary Dealership, the negative deflator means “pipeline price pressures are strong”.
“If companies have pricing power, then these costs will be passed on to the final goods prices over the next few quarters. Nominal growth could then pick up even as real GDP may suffer somewhat depending on the price elasticity of demand,” they said in a note this week.
So what’s the correct deflator?
When the updated numbers were first released earlier this year in February, the double-deflation was done using the CPI, WPI and their sub-indices. What changed between February and Monday and led to the several revisions of past GDP growth data is that the double-deflation is now being done using the PPI, which measures the prices received by producers at the factory gate, which would exclude net tax and trade and transport margins.
Story continues below this ad
Why does it matter if the CPI, WPI, or output PPI is used for double-deflation? Because any sector’s outputs and inputs should be deflated by the correct index. This was a problem in the old series, especially the services sector.
Consider the last quarterly GDP numbers released under the old series (2011-12 base year), for July-September 2025. In those numbers, the services sector deflator implied by the nominal and real growth rates was just 1.2%. This seemed too low a number for services inflation.
The ‘implicit’ services deflator was low because it was mostly the WPI that was used to deflate the sector’s nominal GVA in the old series. But the WPI is made up of only goods and contains no services.
So, when wholesale inflation was low due to soft commodity prices, the services sector’s nominal GVA was deflated by a number smaller than the inflation the sector may have been facing. As a result, real GVA of services was larger than it should have been, leading to overestimation of real growth. The opposite would have happened when commodity prices were rising too rapidly.
With the PPIs, MoSPI now has more than 300 deflators to arrive at various real GVA values, compared to around 180 under the old series. What this means is that the GVA of more sectors and sub-sectors is being measured accurately.
The new series and deflator processes do not mean India’s GDP numbers have reached peak accuracy. For one, the input PPI is still at a trial stage and only exists for the manufacturing sector. More will be understood when MoSPI releases its ‘Sources and Methods’ document that details the compilation, data sources, and methodologies used in the new series. It is expected to be published later this month.

A Court divided by its own architecture
By Sohail Khan · 3 Oct
India’s Model BIT — a decade later, amid changes
By Sohail Khan · 2 Oct