Explained: India’s economy: Back to goldilocks or a false dawn?
The start of the US-led war in Iran on the last day of February made many analysts revise down the growth outlook for the Indian economy. After registering more than 7 per cent growth in GDP over the past three financial years (see CHART 1) — a period over which inflation rate was also brought down sharply (see CHART 2) — most thought that the war in West Asia will dent the trajectory of India’s economy.
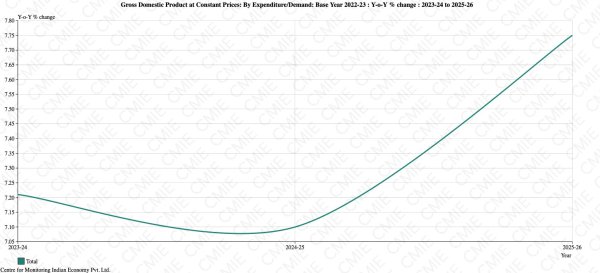 CHART 1: GDP
It was expected that growth rate will slow down to below 7% — many even predicting a rate closer to 6% than 7% — while inflation rate was expected to skyrocket from the lows of 2% (the lower benchmark of RBI’s comfort zone) in the last financial year (2025-26) to reach closer to the upper limit of RBI’s comfort zone of 6%.
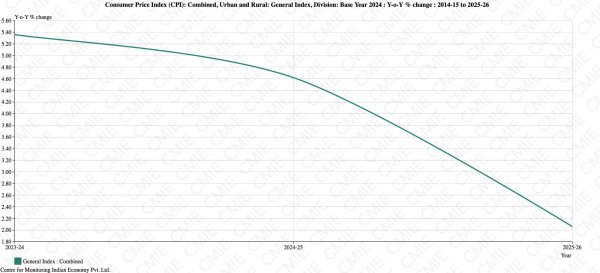 CHART 2: Inflation
That’s because a war in West Asia essentially meant high prices of crude oil, fertilisers and other key imports, reduced foreign investments in the economy, lower demand in the global market for Indian exports, worsening of India’s trade balance, weakening of the rupee exchange rate etc. Making matters worse was the threat of high temperatures thanks to El Niño that threatened to hit food production and provide another spike to inflation.
Story continues below this ad
In short, growth was supposed to slow down meaningfully and inflation to climb sharply. A key moment was when on May 11, Prime Minister Narendra Modi appealed to Indians to tighten their belts by stopping purchases of gold, reducing consumption of fuel, working from home or using public transport etc.
Resilient economy or an incomplete picture
The term “goldilocks” was being used to describe the state of Indian economy at the start of the calendar year — it essentially means an optimal state of affairs — but quickly lost favour once the war in West Asia exposed the more persistent weaknesses in the Indian economy, best captured by the sharp fall in rupee’s exchange rate.
As such, it makes sense to carefully examine whether the Indian economy has genuinely gone back to being goldilocks or does the benign macroeconomic data hide significant risks.
In a detailed note, HSBC economists led by Pranjul Bhandari have explained both the scenarios namely, why India’s macros did not worsen as much as was expected and also what are the triggers that may yet make the picture worse.
On GDP growth
Story continues below this ad
In a recent note, researchers at Centre for Monitoring Indian Economy (CMIE) also noted that “India is expected to have sailed through the June 2026 quarter better than feared”. Notwithstanding the worst of the energy crisis during the first quarter (April, May and June) of the current financial year, HSBC’s 100-indicators of growth database points towards India’s GDP growing by 7-7.5% during this period. State Bank of India’s research team has gone a step further, projecting an 8% growth in GDP in the first three months of the current financial year (2026-27).
So what are the factors undergirding this economic resilience?
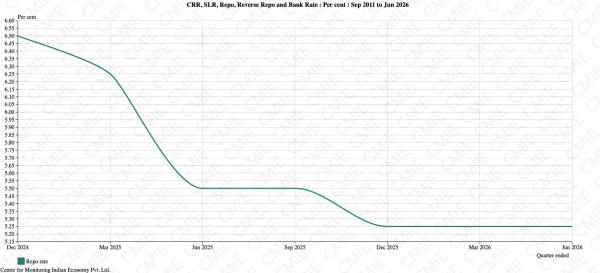 CHART 3: repo rate
Some of it can be ascribed to the 125 basis points (or 1.25 percentage points) cut in the repo rate between December 2024 and December 2025 (see CHART 3). Repo rate is the interest rate at which the RBI lends money to commercial banks in India. When the RBI cuts the repo rate, it makes it cheaper for banks to borrow money from the RBI and, in turn, cheaper for individuals and businesses to borrow money from commercial banks. Cheaper loans incentivise economic activity in the economy, thus boosting growth.
Often the “transmission” of repo rate cut takes a couple of quarters (6 months) before it starts showing up as a faster GDP growth rate.
Another factor could be the effect of cuts in Goods and Services Tax in 2025. Lower tax rates reduced prices and improved people’s purchasing power, thus resulting in more purchases and higher economic activity. Yet another factor noted by HSBC economists is the rise of India’s exports to the US as Trump’s tariffs were removed. Lastly, there is evidence to suggest that manufacturers front-loaded production as they were anxious about even the availability of energy in the future.
On inflation
Story continues below this ad
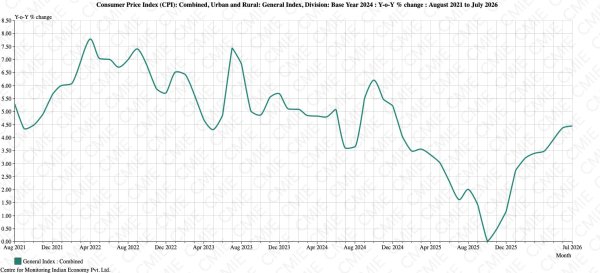 CHART 4: Monthly inflation
While it is true that monthly retail inflation rate — or the rate at which the general price level went up over the past year — has moved up since October 2025, it is also true that overall, it is still well-contained and pretty close to the RBI’s target level of 4 per cent (see CHART 4). Many, including HSBC, had feared inflation to surge to far more uncomfortable levels.
Often, inflation remains muted because growth is muted but as explained before, this doesn’t seem to have been the case. Inflation has remained muted despite supply pressures as well demand holding up fairly well.
On Current Account
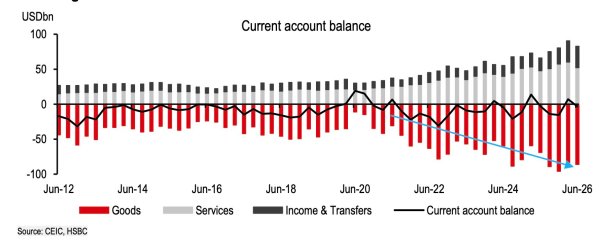 CHART 5: Current Account Deficit
Current Account refers to the net amount of money flowing in or out of India as it trades (exports and imports) goods as well as services with the rest of the world.
Typically, when India is growing fast as well as when imports (such as crude oil) are getting costlier, the country imports more goods than it exports, thus leading to what is called a trade deficit. It refers to the billions of dollars flowing out of India as it spends more dollars on imports than what it earns through exports.
Story continues below this ad
Further, more often than not, what India earns from exports of services (like software services) as well as from the remittances from Indians working abroad, is not enough to cover the dollars India shells out for imports of goods (over and above what it earns from exports). The net result is called a Current Account Deficit.
But despite fast growth and costlier imports, India’s Current Account Deficit too has remained fairly muted.
“The headline c/a deficit is low at 0.3% of GDP as per RBI’s aggregated monthly data, and not showing signs of excesses,” notes the HSBC economists (see CHART 5).
Could things be read differently?
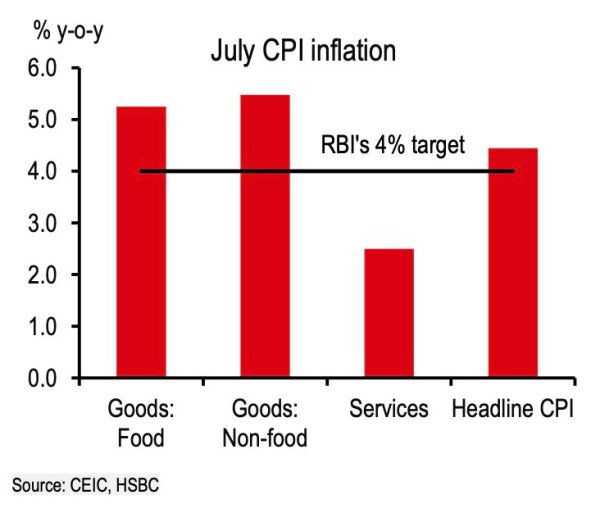 CHART 6: Inflation breakup
Yes. While on the face of it, all these macro indicators look counter-intuitively robust, there are risks that can yet drag down growth and push up inflation. Here’s how.
Story continues below this ad
On growth, HSBC researchers state that a lot of the credit growth (increased loans) has been driven by factors such as “the new government credit guarantee scheme for small firms, the rise in working capital needs spurred by higher commodity prices, and the proliferation of gold loan growth (which can sometimes be seen as an indicator of stress).”
Moreover, it can also be argued that “while frontloading of manufacturing has spurred it can be followed by a lull”. Moreover, agricultural growth could be weaker if the El Niño strengthens into the year-end.
On inflation, as CHART 6 shows, the overall benign level of inflation rate hides fairly divergent trends. HSBC Research stated that food inflation and non-food goods inflation is already averaging 5.4% (year-on-year) in July.
What is holding back the headline inflation from surging is that services (which account for 33% of the weight in retail inflation calculations) has remained “remarkably low at 2.5%”. And therein lies the risk.
Story continues below this ad
“Low services inflation data is keeping headline (rate) contained. If it rises from here, reflecting growth better, headline inflation numbers could rise quickly,” notes HSBC.
Similarly, on current account deficit, a closer look at CHART 5 shows that the current account deficit is low as of now because even though the goods trade deficit is growing, rising services exports and remittances are offsetting the rise in trade deficit”, thus keeping the current account deficit low.
HSBC wonders what will happen if this luck runs out.
“But given the uncertainties around the impact of AI on services exports growth, one needs to be careful on how long services can fund a rising goods deficit. Already, services exports have grown at a softer pace this year,” notes HSBC.
Upshot
Story continues below this ad
Few expected India to survive this phase of global disruption without taking a big hit.
HSBC researchers argue that it is the services sector that is saving India the blushes as of now.
It is a fact that the services sector which accounts for 55% of India’s GDP plays a very important role in determining where growth will land, how long inflation will remain low, and till when will external deficits be contained.
“Low services inflation and high services exports are keeping a lid on inflation and external imbalances, respectively,” states HSBC.
Story continues below this ad
If services inflation goes up and services exports take a hit, the RBI may be forced to raise interest rates, which, in turn, will likely dampen India’s growth.


What could be a just, dignified and lasting peace in Ukraine?
By Sohail Khan · 29 Sep
Power from renewables should not be curtailed
By Sohail Khan · 29 Sep