Is Wall Street’s calm about to end? What rising VIX means for S&P 500 stocks
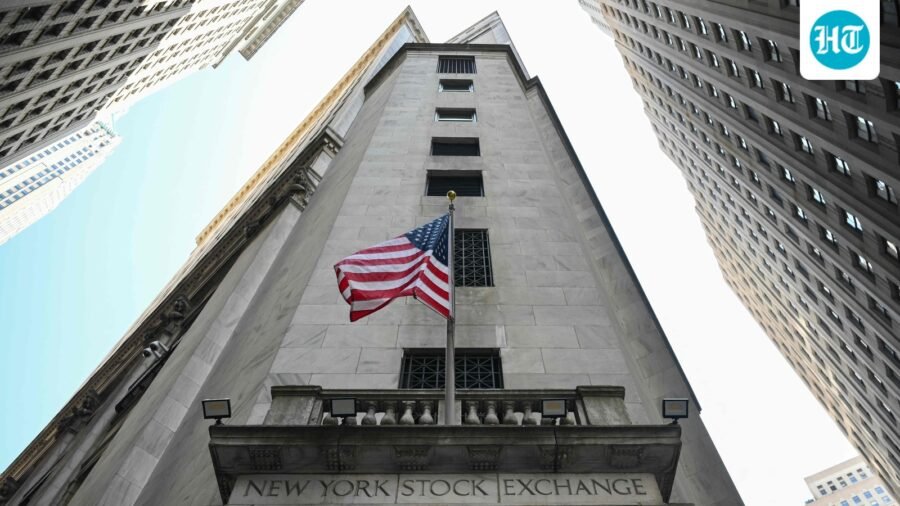
Is Wall Street’s calm about to end? What rising VIX means for S&P 500 stocks
Wall Street’s calm may fade as the VIX rises in September. Here’s what higher volatility could mean for S&P 500 stocks and the market outlook.
Updated on: Aug 30, 2026, 19:47:47 IST
Prefer HTon Google
Share via
Copy link
Wall Street is ending August in an unusually calm mood, but that calm may not last much longer. The CBOE Volatility Index, or VIX, fell to 14.13 on Friday, its lowest level of 2026. The current calm is very different from what happened earlier this year.
In the spring, market volatility jumped sharply as headlines around the Iran war rattled investors. Volatility then slowly came down through the summer. But the market calendar suggests volatility could start picking up again. The VIX has historically started rising around this time of the year, meaning Wall Street could be heading into a more active period after a quiet summer.
Wall Street volatility may rise again
Historical data shows that the VIX often rises from late August to early fall. Since 1990, the VIX has had a median level of about 16.5 in late August. It has then usually risen to around 18 by mid-September and about 19 in early October, according to data cited by Yahoo Finance.
What does the VIX mean for S&P 500 stocks?
A higher VIX does not always mean the S&P 500 will fall. The VIX measures how much market movement investors expect. It does not show whether stocks will go up or down. The VIX is based on S&P 500 options and shows expected market volatility over the next 30 days. In very simple terms, the VIX shows how much movement investors expect in S&P 500 stocks over the next month.
This means investors should not treat the VIX as a direct “stock market crash” signal. A rising VIX only means investors are expecting bigger market moves. Those moves can be either higher or lower. Stocks can still rise even when the VIX is high. At the same time, stocks can fall even when the VIX is low. The key difference is that higher volatility means the range of possible market outcomes becomes wider.
Why September could be weak for stocks
That wider range of outcomes could become important for S&P 500 stocks as September begins. After several quiet months, investors may have to prepare for bigger daily swings in stocks. September is already a historically weak month for the S&P 500. Since 1950, the S&P 500 has recorded an average 0.6% decline in September, making it the weakest month of the year based on the historical data cited by Yahoo Finance.
S&P 500 seasonality in midterm years
The pattern becomes more noticeable during US midterm election years. Stocks have often struggled from late summer into early fall during midterm years before recovering later in the season. Historical S&P 500 data shows September has been weaker during midterm years. The S&P 500 has averaged a 0.8% decline in September during midterm years, compared with a 0.6% decline across all years.
But the story changes sharply after September. October has historically produced an average 0.9% gain for the S&P 500 across all years, while November has averaged a stronger 1.9% gain, according to the historical data cited by Yahoo Finance. Midterm election years have shown an even stronger rebound in October and November.
During those years, the S&P 500 has averaged a 3% gain in October and a 2.8% gain in November. So the historically scary part of the calendar does not necessarily stay scary. September has often been weak, but October and November have historically been much stronger, especially during US midterm election years.
Higher VIX does not mean a stock market crash
For investors in S&P 500 stocks, this means higher volatility does not automatically signal a major market breakdown. A jump in the VIX could simply mean the market is moving back toward its normal seasonal pattern.
The current VIX level also gives the market plenty of room to become more volatile. With the VIX ending August at 14.13, a move into the high teens would not be unusual based on historical levels. Even a move into the low or mid-20s would not necessarily mean Wall Street is in trouble. The VIX could rise toward those levels simply because investors are pricing in bigger market moves during September and October.
What S&P 500 investors should watch
The bigger question for S&P 500 investors is therefore not simply whether the VIX rises. Investors will need to watch how sharply volatility rises and what is driving it, because a higher VIX can happen during both market rallies and sell-offs. Seasonality should also not be treated as a guaranteed trading signal. Historical patterns come from many different market conditions, and there is no guarantee that 2026 will follow the same path as previous years.
Wall Street calm may not last
That is especially important because 2026 has already behaved differently in several ways. The market has already experienced a major volatility spike linked to Iran war headlines before settling down during the summer, according to Yahoo Finance. For now, Wall Street is still relatively calm.
A VIX reading of 14.13 shows that investors are pricing in relatively limited movement in the S&P 500 over the near term. But that calm could fade as September and October arrive. If the VIX moves back toward 18–19, or even into the low-to-mid 20s, it would not automatically mean the S&P 500 is heading for a crash.
Instead, it could simply mean Wall Street is returning to a more normal level of uncertainty for this part of the year. For S&P 500 investors, the key takeaway is that more volatility does not always mean lower stocks — it means bigger potential moves in either direction.
See Less

US stocks: US market falls as higher oil prices, Treasury yields weigh
By Sohail Khan · 29 Sep
Japan’s big India content bet goes beyond Doraemon
By Sohail Khan · 29 Sep
If patents get pricey, Kerala HC says govt can act
By Sohail Khan · 29 Sep